L’obbiettivo del progetto è l’implementazione di un sommatore floating point secondo lo standard IEEE754, comprensivo dei numeri speciali NaN e infinity, che calcoli correttamente la somma e la sottrazione esclusivamente di numeri normalizzati.
Il sommatore deve essere realizzato mediante una architettura pipelined, scegliendo la suddivisione in stadi il più possibile bilanciati.
Una volta realizzato il componente, è richiesto di realizzare un test-bench per la simulazione e la verifica del corretto funzionamento nei diversi casi.
Implementazione
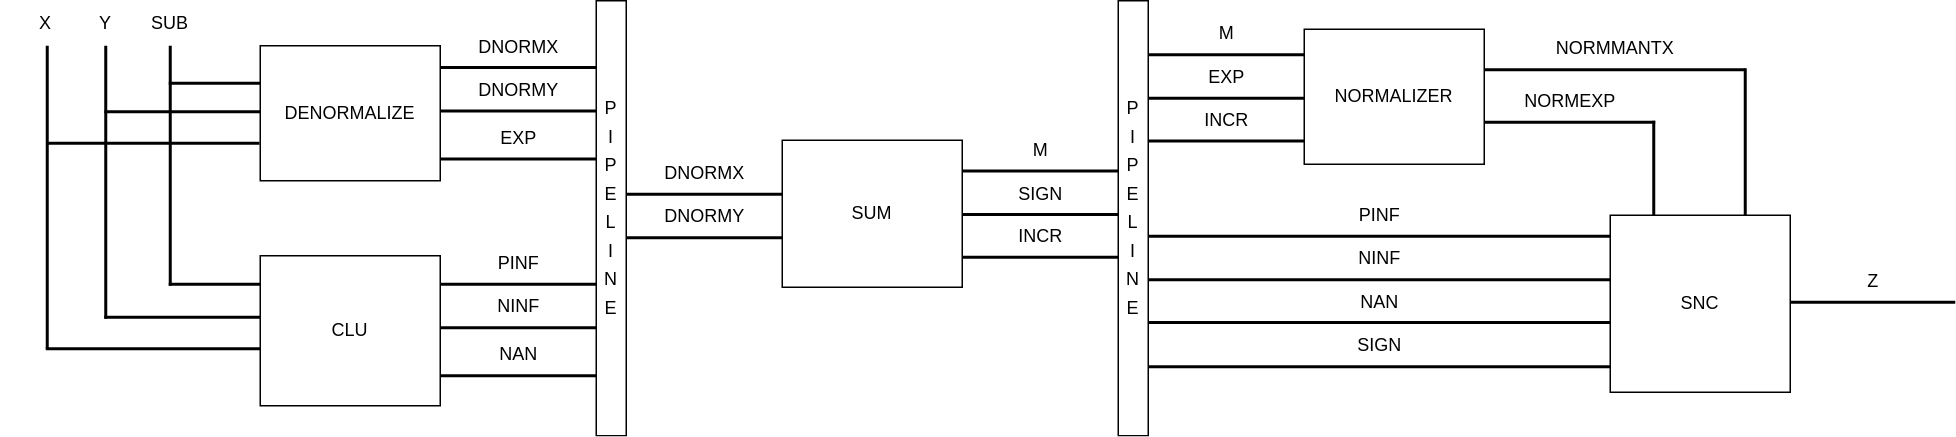
Il dispositivo utilizza una pipeline a tre stadi i cui ritardi sono stati stimati rispettivamente a 25.4 ns, 27.0 ns e 25.3 ns, per questo si è deciso di utilizzare un segnale di clock di 30 ns, di seguito una rappresentazione semplificata degli stadi della pipeline:
Il primo stadio prende gli input del top-level produce i numeri X e Y normalizzati, DNORMX corrisponde sempre al numero più piccolo e DNORMY al numero più grande, nel caso il numero più piccolo sia negativo sarà prodotto il suo complemento a uno (a cui verrà sommato 1 nel prossimo stadio della pipeline per produrre il complemento a due), il numero più grande viene invece eventualmente inoltrato in complemento a due. Gli input del top-level sono inoltre analizzati dal modulo CLU per produrre i segnali PINF, NINF e NAN (tutti da un solo bit) che indicano se l’output dell’operazione è un numero speciale, è importante notare che questi segnali sono one-hot, non è infatti possibile che il risultato possa essere allo stesso tempo due numeri speciali diversi. Questi segnali possono valere 1 solo se almeno uno degli input del top-level è un numero speciale. Viene anche inoltrato allo stadio successivo l’esponente del numero più grande.
Il secondo stadio si occupa di eseguire la somma tra le mantisse dei numeri denormalizzati e di produrre un segnale su 24 bit che rappresenta la mantissa denormalizzata (comprensiva dell’1 omesso nella rappresentazione normalizzata) in notazione unsigned. Vengono poi inoltrati allo stadio successivo il segnale SIGN da un solo bit dal valore 1 se il risultato dell’operazione è negativo, 0 altrimenti (non è previsto un valore fisso per SIGN nel caso il risultato sia zero) e il segnale INCR da un bit che indica se a causa di un overflow nella somma sarà necessario incrementare l’esponente del risultato. I segnali non utilizzati sono inoltrati allo stadio successivo.
Il terzo stadio si occupa in primo luogo di normalizzare il risultato ottenuto allo stadio precedente shiftando la mantissa M a destra o a sinistra in base all’output di un priority encoder e sottraendo al segnale EXP il numero di bit di cui la mantissa viene shiftata verso destra. Dopo aver ottenuto un numero normalizzato si controlla in base ai valori dei segnali PINF, NINF e NAN se il risultato deve essere modificato a causa di un operando speciale. Il segnale SIGN viene copiato nel bit più significativo del risultato per indicare il segno.
È bene ricordare che gli ingressi e le uscite sono campionate ogni 30 ns, l’output corretto sarà quindi disponibile solo dopo quattro cicli di clock. Per ulteriori dettagli sull’implementazione e sulla funzione dei test bench, consultare la documentazione.
Utilizzo
Per testare il funzionamento del dispositivo è necessario creare un nuovo progetto sulla piattaforma Xilinx ISE, successivamente dopo aver aggiunto tutti i file .vhd al progetto (non è necessario aggiungere i test bench, il cui nome termina per _TB) si potrà procedere alla creazione di nuovi test bech per verificare il corretto funzionamento del dispositivo.
Si noti che l’implementazione presente è stata progettata e testa per un dispositivo Spartan6 XC6slx75T del package FGG676 con velocità -4, l’utilizzo di dispositivi diversi potrebbe non essere supportata.
The loss optimisation of loan recovery decision times using forecast cash flows
A theoretical method is empirically illustrated in finding the best time to forsake a loan such that the overall credit loss is minimised. This is predicated by forecasting the future cash flows of a loan portfolio up to the contractual term, as a remedy to the inherent right-censoring of real-world `incomplete’ portfolios. Two techniques, a simple probabilistic model as well as an eight-state Markov chain, are used to forecast these cash flows independently. We train both techniques from different segments within residential mortgage data, provided by a large South African bank, as part of a comparative experimental framework. As a result, the recovery decision’s implied timing is empirically illustrated as a multi-period optimisation problem across uncertain cash flows and competing costs. Using a delinquency measure as a central criterion, our procedure helps to find a loss-optimal threshold at which loan recovery should ideally occur for a given portfolio. Furthermore, both the portfolio’s historical risk profile and forecasting thereof are shown to influence the timing of the recovery decision. This work can therefore facilitate the revision of relevant bank policies or strategies towards optimising the loan collections process, especially that of secured lending.
Structure
This R-codebase can be run sequentially using the file numbering itself as a structure. Delinquency measures are algorithmically defined in DelinqM.R as data-driven functions, which may be valuable to the practitioner outside of the study’s current scope. Note that scripts 3.2 and 3.3 are interactive scripts wherein the so-called Loss-based Recovery Optimasation across Delinquency (or LROD) procedure is repeatedly run by executing the script with different settings, as set out in the comments. Each independent run produces results that are saved for graphing later on (see the graph-varients of each numbered script where relevant).
Data
This R-codebase assumes that monthly loan performance data are available. Naturally, the data itself can’t be made publically available due to non-disclosure agreements signed with the particular bank in question. However, the structure and type of data that is required for reproducing this study, is sufficiently described in the commentary within the scripts. This should enable the practitioner to extract and prepare data accordingly.
Copyright
All code and scripts are hereby released under an MIT license. Similarly, all graphs produced by relevant scripts as well as those published here, are hereby released under a Creative Commons Attribution (CC-BY 4.0) licence.
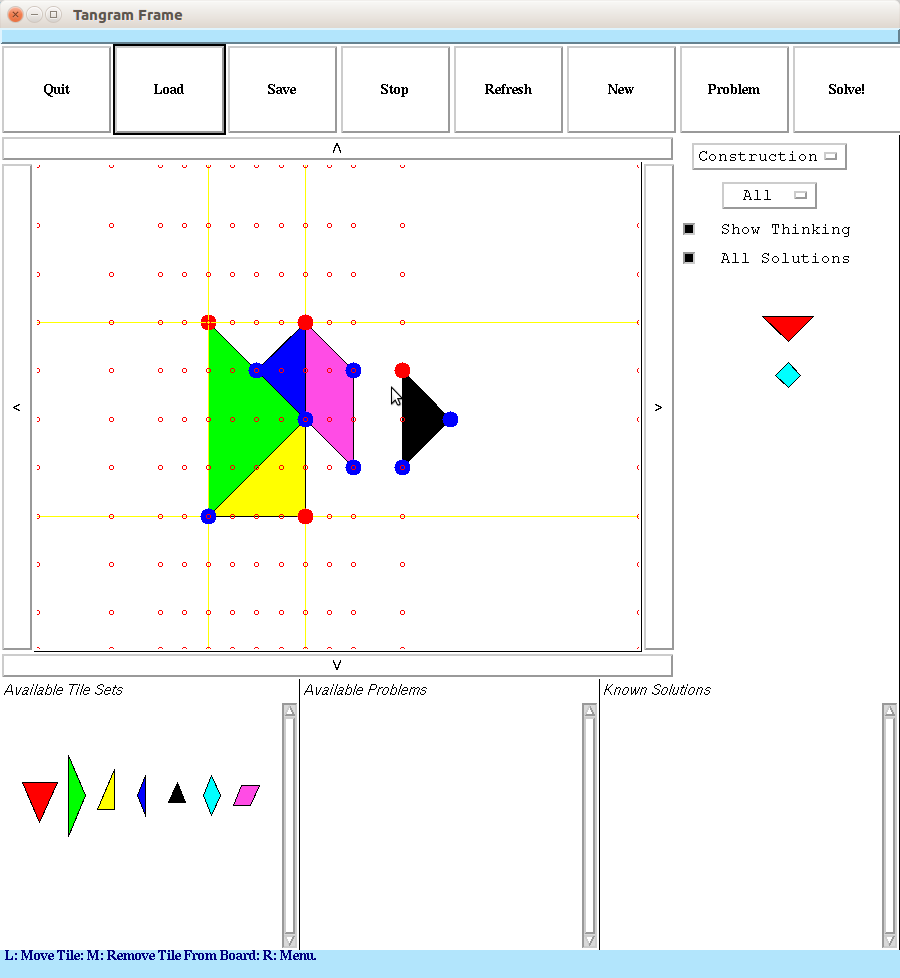
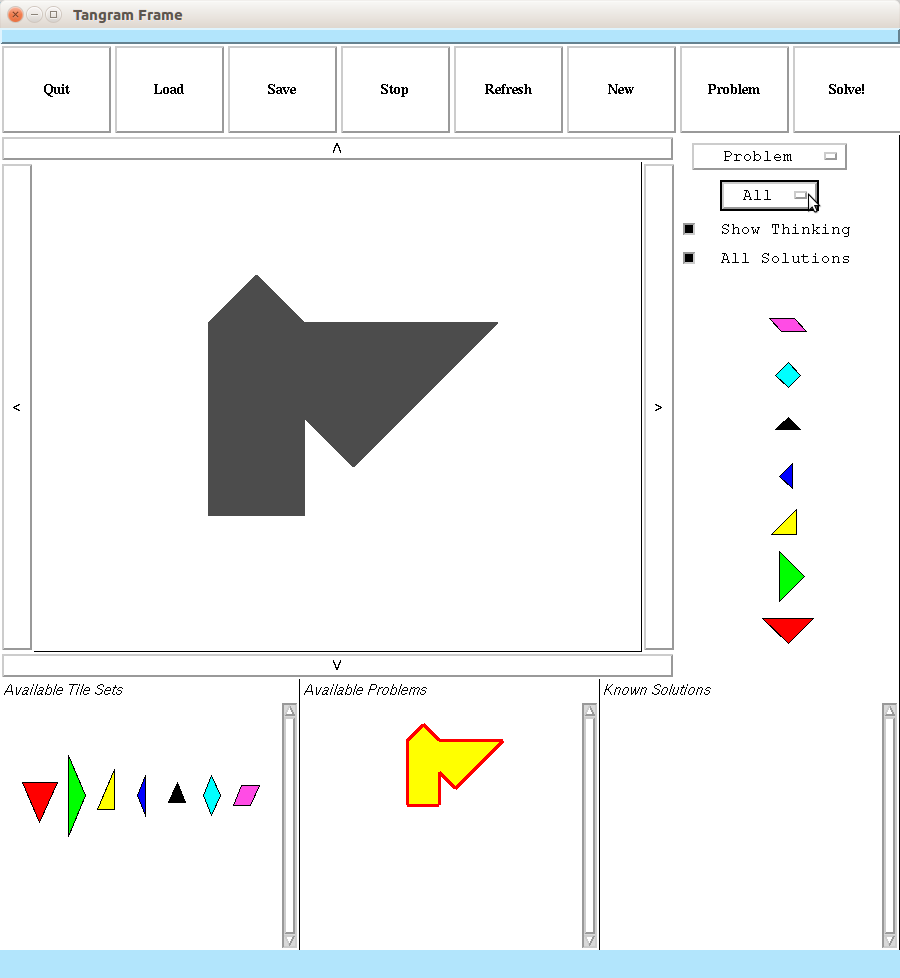
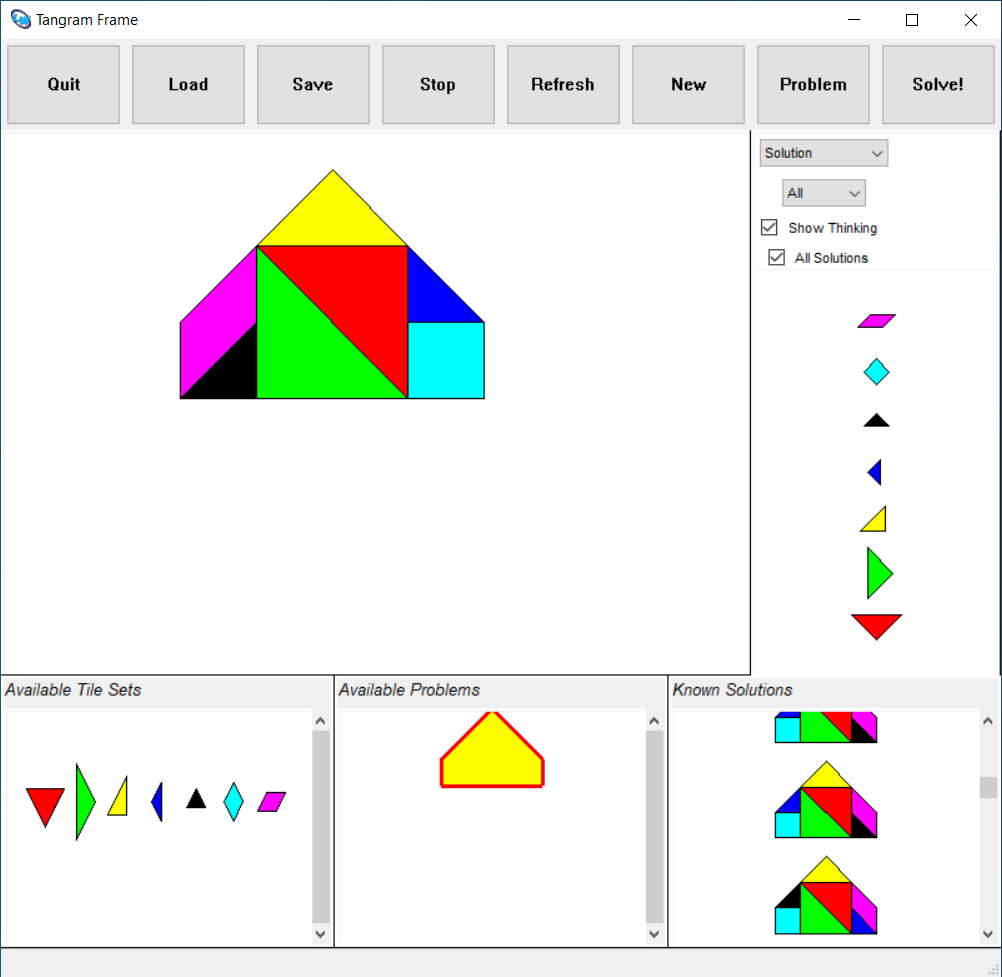
A Tangram Puzzle Solver in Common Lisp that is capable of solving arbitrary geometric tiling problems, utilizing CLIM (Common Lisp Interface Manager) for its GUI.
About
This was written in Common Lisp in 2003, using CLIM (Common Lisp
Interface Manager) for its GUI. It compiles with LispWorks 6.1 and 7.1
with CLIM, on Windows, Linux, and Mac. I can only support Windows and
Linux, but it is known to run on a M1 Silicon Mac as well (see below).
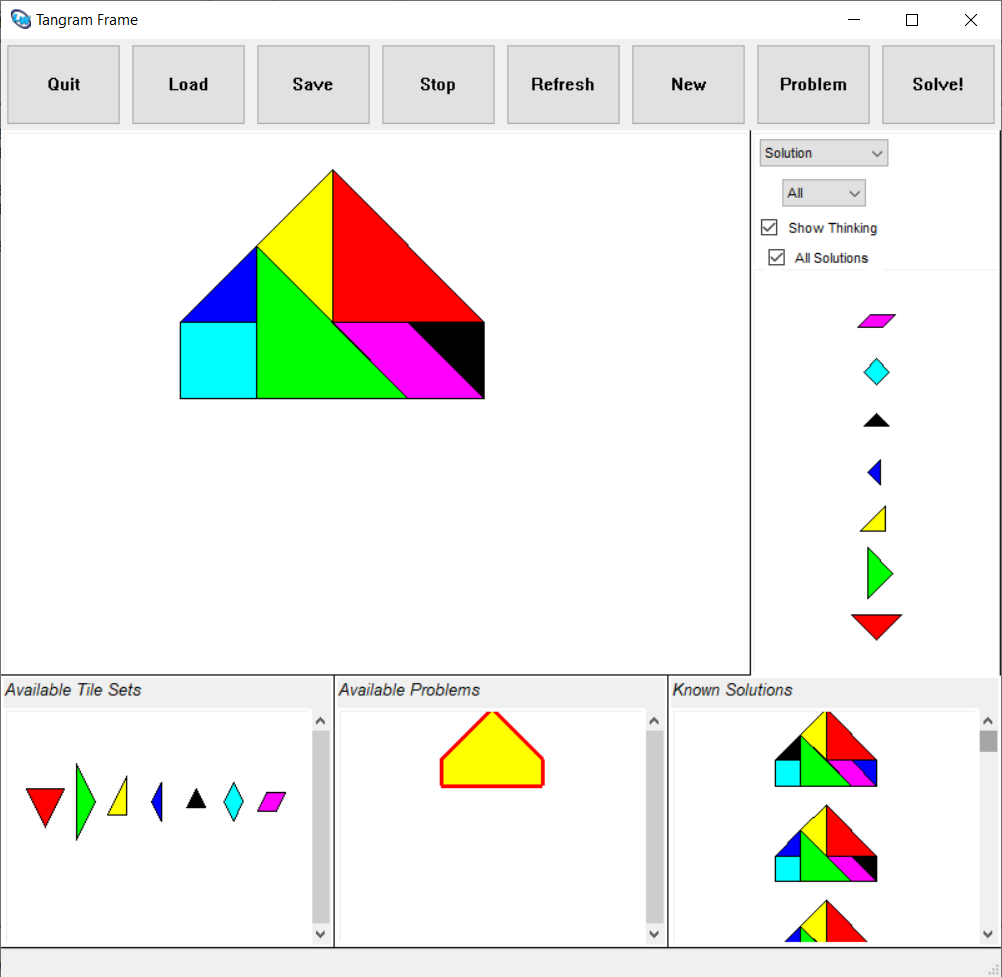
On my 2012 iCore 7 2.4 GZ 8 GB Ubuntu Xenial PC, thanks to its
geometric search heuristics, it takes ~ 10 seconds to solve the
following problem:
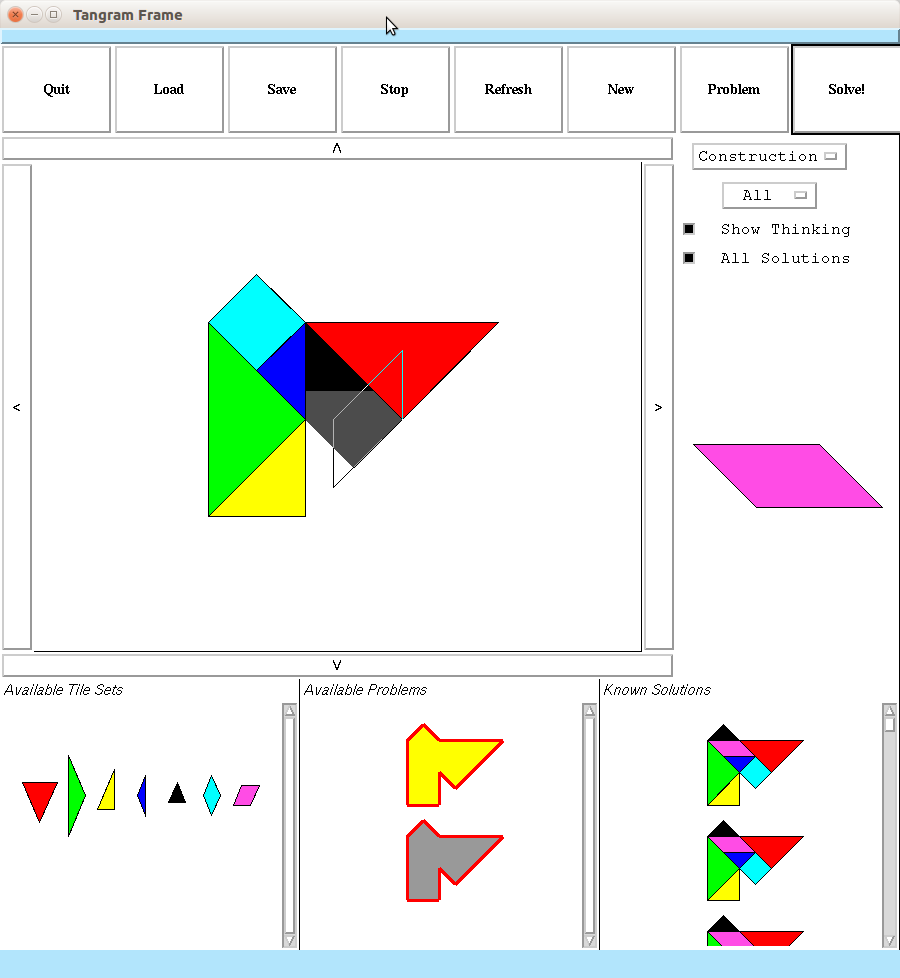
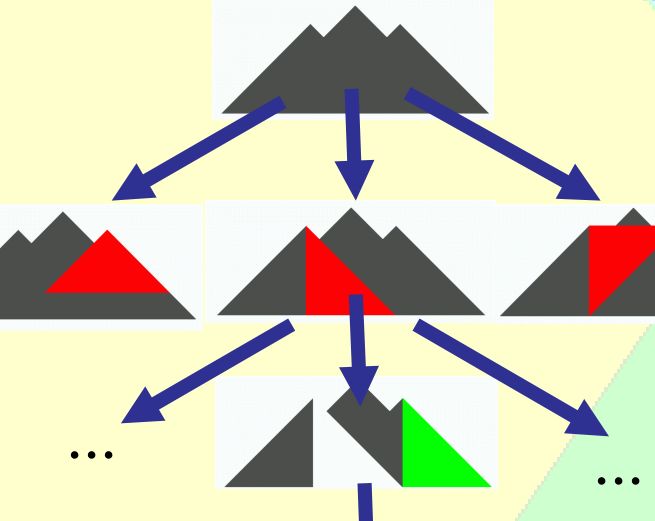
The solver uses geometric search:
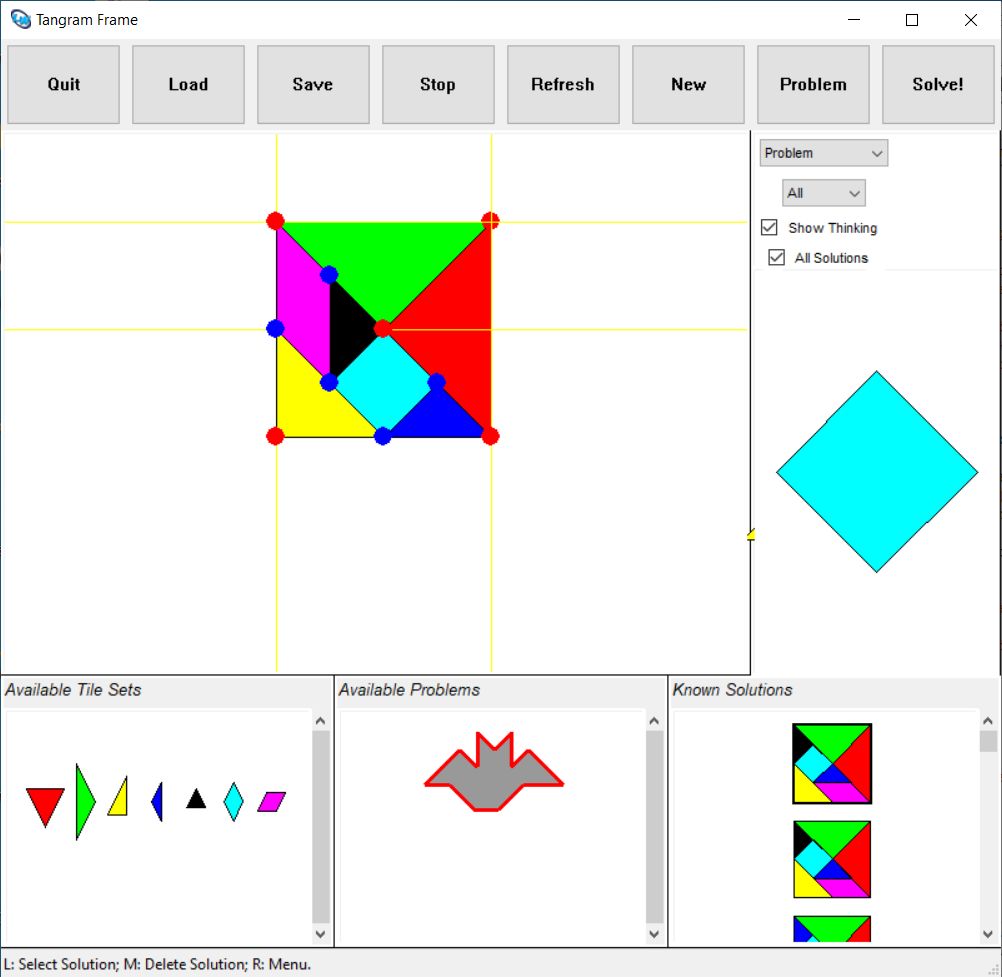
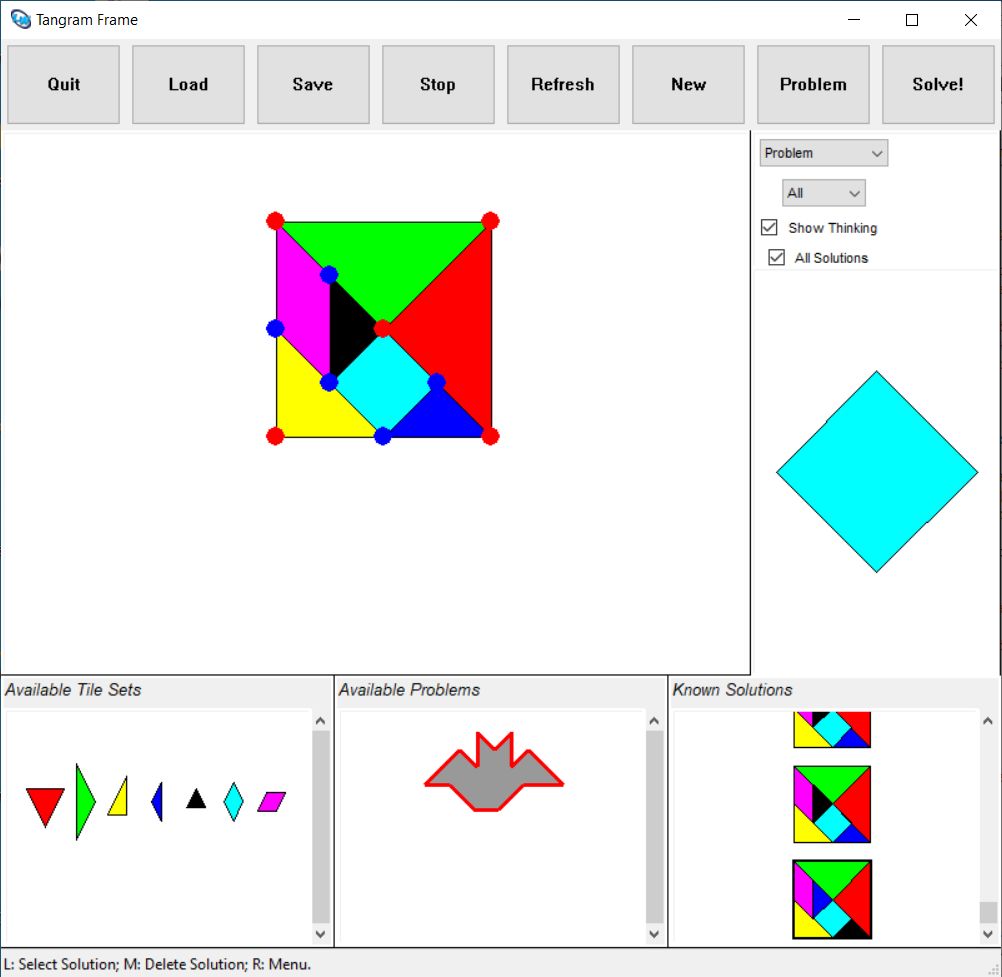
This is work in progress. The heuristics are being changed from time
to time. Currently, with the above machine configuration, it takes
about ~3 minutes and 50 seconds for it to solve the standard Tangram problem
if “Show Thinking” is unchecked, and ~6 minutes and 30 seconds with
“Show Thinking” enabled:
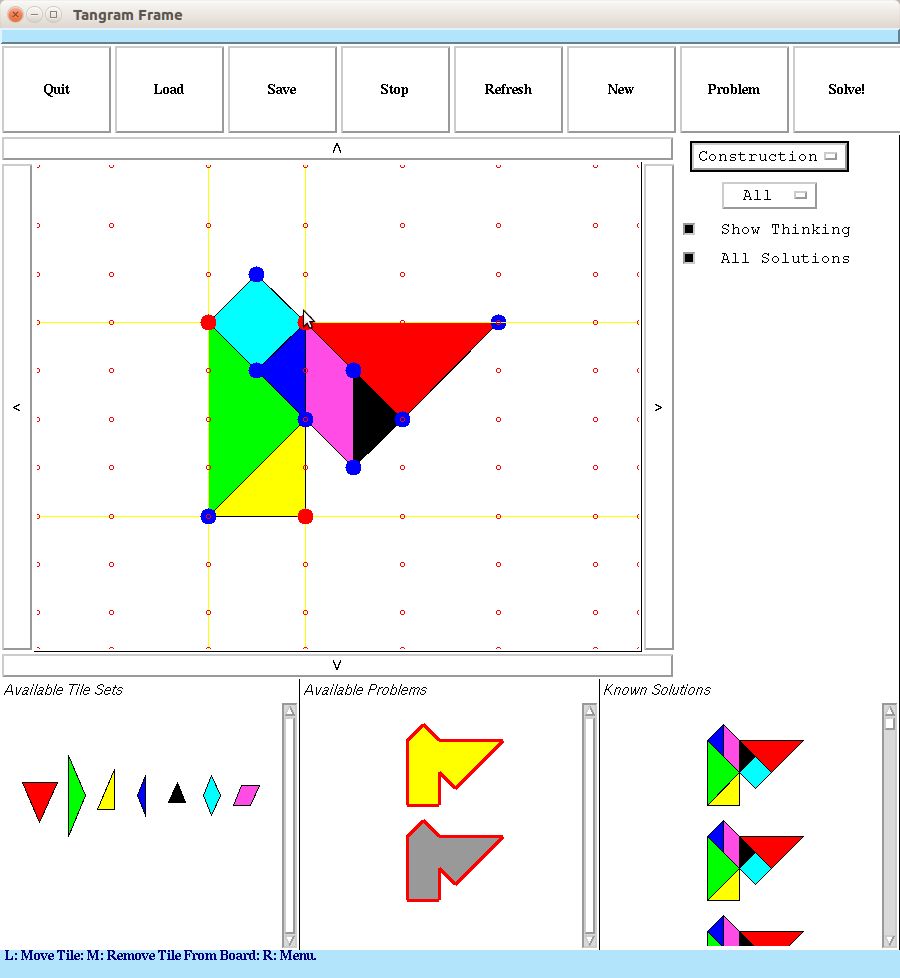
Other problems are much faster. The solver frequently finds
innovative solutions. Problems in .tan format are
src/problems folder.
History
The program was written in 2003. I resurrected the code in March 2021
and fixed some major bugs that were responsible for severe
incompleteness. It is performing much better by now!
The geometric substrate support functions were written by the author
during his computer science master and PhD endeavors, from 1996 to
2003.
Installation (Windows, Linux, Mac)
You will need LisWorks (6.1, 7.1) with CLIM if you want to run it from
source, or even build the application. Else, exectuables are provided
for Linux32 and Windows (see below).
On Linux, I needed to install a number of (in my case, 32bit) legacy
libraries, like (32bit) Motif etc. in order to get is going. It is
much more straightforward with Windows (tested on 64bit Windows 10).
If you want to build it from source, check out the
src/tangram-sysdcl.lisp. Adjust the
logical "tangram" pathname to match your environment. Then, as shown
at the end of the file, do a
Thanks to Rainer Joswig (Lispm) for checking it out with the new
Silicon Macs and LispWorks 7.1 (I only have 6.1), for spreading the
word, and for tipps regarding the application delivery process (FLI
template collection).
Para a busca de dados de um determinado número de CEP instancie a classe ZipCodeLoad e no seu método Find ou FindAsync passe o número e se a resposta estiver satisfatória os dados estão na classe de resultado ZipCodeResult, exemplo:
IZipCodeLoadzipCodeLoad=newZipCodeLoad();ZipCodeResultresult0=zipCodeLoad.Find("01001000");if(result0)// ou result0.IsValid{ZipCodeItemzipCodeItem=result0;//ou zipCodeItem zipCodeItem = result0.Value;}
A saída da classe ZipCodeItem é a seguir:
ZipCodeItem.Zip        // cep
ZipCodeItem.Address    // logradouro
ZipCodeItem.District   // bairro
ZipCodeItem.City       // localidade
ZipCodeItem.Uf         // uf
ZipCodeItem.Ibge       // Ibge
ZipCodeItem.Complement // complemento
ZipCodeItem.Gia        // gia
ZipCodeItem.Siafi      // siafi
ZipCodeItem.Ddd        // ddd
ZipCodeItem.Unity      // unidade
ZipCodeItem.State      // estado
ZipCodeItem.Region     // região
Busca de uma lista de CEP
IAddressCodeLoadaddressCodeLoad=newAddressCodeLoad();AddressCodeaddressCode=AddressCode.Parse(ZipCodeUf.SP,"SÃO PAULO","AVE");AddressCodeResultresult1=addressCodeLoad.Find(addressCode);if(result1)// ou result1.IsValid{AddressCodeItemitems=result1;// ou AddressCodeItem items = result1.Value;}
Note que a saída da classe AddressCodeItem é uma enumeração (List<>) de ZipCodeItem, ou seja, List<ZipCodeItem>.
Lista de Unidade Federativa
Tanto no objeto de instancia das classes AddressCodeLoad e ZipCodeLoad existe um método de extensão que retorna um IDictionary<string, string> que pode ser utilizado em suas telas para padronização da informação, exemplo:
IZipCodeLoad zipCodeLoad = new ZipCodeLoad();
IAddressCodeLoad addressCodeLoad = new AddressCodeLoad();

System.Collections.Generic.IDictionary<string, string> items0_List = zipCodeLoad.UFToList();
System.Collections.Generic.IDictionary<string, string> items1_List = addressCodeLoad.UFToList();
Essas duas variaveis (items0_List e items1_List) são da mesma instância e são geradas a partir do EnumZipCodeUf o mesmo para facilitar na criação de suas interfaces de programação.
Aplicação MVC Core
No exemplo do controllerTestController tem dois métodos:
It will create an interactive treemap visualization of the contents of all your bundles.
This module will help you:
Realize what’s really inside your bundle
Find out what modules make up the most of its size
Find modules that got there by mistake
Optimize it!
And the best thing is it supports minified bundles! It parses them to get real size of bundled modules.
And it also shows their gzipped or Brotli sizes!
Options (for plugin)
newBundleAnalyzerPlugin(options?: object)
Name
Type
Description
analyzerMode
One of: server, static, json, disabled
Default: server. In server mode analyzer will start HTTP server to show bundle report. In static mode single HTML file with bundle report will be generated. In json mode single JSON file with bundle report will be generated. In disabled mode you can use this plugin to just generate Webpack Stats JSON file by setting generateStatsFile to true.
analyzerHost
{String}
Default: 127.0.0.1. Host that will be used in server mode to start HTTP server.
analyzerPort
{Number} or auto
Default: 8888. Port that will be used in server mode to start HTTP server. If analyzerPort is auto, the operating system will assign an arbitrary unused port
Default: http://${listenHost}:${boundAddress.port}. The URL printed to console with server mode.
reportFilename
{String}
Default: report.html. Path to bundle report file that will be generated in static mode. It can be either an absolute path or a path relative to a bundle output directory (which is output.path in webpack config).
reportTitle
{String|function}
Default: function that returns pretty printed current date and time. Content of the HTML title element; or a function of the form () => string that provides the content.
defaultSizes
One of: stat, parsed, gzip, brotli
Default: parsed. Module sizes to show in report by default. Size definitions section describes what these values mean.
compressionAlgorithm
One of: gzip, brotli
Default: gzip. Compression type used to calculate the compressed module sizes.
openAnalyzer
{Boolean}
Default: true. Automatically open report in default browser.
generateStatsFile
{Boolean}
Default: false. If true, webpack stats JSON file will be generated in bundle output directory
statsFilename
{String}
Default: stats.json. Name of webpack stats JSON file that will be generated if generateStatsFile is true. It can be either an absolute path or a path relative to a bundle output directory (which is output.path in webpack config).
statsOptions
null or {Object}
Default: null. Options for stats.toJson() method. For example you can exclude sources of your modules from stats file with source: false option. See more options here.
excludeAssets
{null|pattern|pattern[]} where pattern equals to {String|RegExp|function}
Default: null. Patterns that will be used to match against asset names to exclude them from the report. If pattern is a string it will be converted to RegExp via new RegExp(str). If pattern is a function it should have the following signature (assetName: string) => boolean and should return true to exclude matching asset. If multiple patterns are provided asset should match at least one of them to be excluded.
logLevel
One of: info, warn, error, silent
Default: info. Used to control how much details the plugin outputs.
Usage (as a CLI utility)
You can analyze an existing bundle if you have a webpack stats JSON file.
You can generate it using BundleAnalyzerPlugin with generateStatsFile option set to true or with this simple
command:
webpack --profile --json > stats.json
If you’re on Windows and using PowerShell, you can generate the stats file with this command to avoid BOM issues:
  -V, --version                   output the version number
  -m, --mode <mode>               Analyzer mode. Should be `server`, `static` or `json`.
                                  In `server` mode analyzer will start HTTP server to show bundle report.
                                  In `static` mode single HTML file with bundle report will be generated.
                                  In `json` mode single JSON file with bundle report will be generated. (default: server)
  -h, --host <host>               Host that will be used in `server` mode to start HTTP server. (default: 127.0.0.1)
  -p, --port <n>                  Port that will be used in `server` mode to start HTTP server. Should be a number or `auto` (default: 8888)
  -r, --report <file>             Path to bundle report file that will be generated in `static` mode. (default: report.html)
  -t, --title <title>             String to use in title element of html report. (default: pretty printed current date)
  -s, --default-sizes <type>      Module sizes to show in treemap by default.
                                  Possible values: stat, parsed, gzip, brotli (default: parsed)
  --compression-algorithm <type>  Compression algorithm that will be used to calculate the compressed module sizes.
                                  Possible values: gzip, brotli (default: gzip)
  -O, --no-open                   Don't open report in default browser automatically.
  -e, --exclude <regexp>          Assets that should be excluded from the report.
                                  Can be specified multiple times.
  -l, --log-level <level>         Log level.
                                  Possible values: debug, info, warn, error, silent (default: info)
  -h, --help                      output usage information
Size definitions
webpack-bundle-analyzer reports three values for sizes. defaultSizes can be used to control which of these is shown by default. The different reported sizes are:
stat
This is the “input” size of your files, before any transformations like
minification.
It is called “stat size” because it’s obtained from Webpack’s
stats object.
parsed
This is the “output” size of your files. If you’re using a Webpack plugin such
as Uglify, then this value will reflect the minified size of your code.
gzip
This is the size of running the parsed bundles/modules through gzip compression.
brotli
This is the size of running the parsed bundles/modules through Brotli compression.
Selecting Which Chunks to Display
When opened, the report displays all of the Webpack chunks for your project. It’s possible to filter to a more specific list of chunks by using the sidebar or the chunk context menu.
Sidebar
The Sidebar Menu can be opened by clicking the > button at the top left of the report. You can select or deselect chunks to display under the “Show chunks” heading there.
Chunk Context Menu
The Chunk Context Menu can be opened by right-clicking or Ctrl-clicking on a specific chunk in the report. It provides the following options:
Hide chunk: Hides the selected chunk
Hide all other chunks: Hides all chunks besides the selected one
Show all chunks: Un-hides any hidden chunks, returning the report to its initial, unfiltered view
Troubleshooting
I don’t see gzip or parsed sizes, it only shows stat size
It happens when webpack-bundle-analyzer analyzes files that don’t actually exist in your file system, for example when you work with webpack-dev-server that keeps all the files in RAM. If you use webpack-bundle-analyzer as a plugin you won’t get any errors, however if you run it via CLI you get the error message in terminal:
Error parsing bundle asset "your_bundle_name.bundle.js": no such file
No bundles were parsed. Analyzer will show only original module sizes from stats file.
To get more information about it you can read issue #147.
Other tools
Statoscope – Webpack bundle analyzing tool to find out why a certain module was bundled (and more features, including interactive treemap)
This is a WIP; ideally, it will provide a tool to properly scrape the contents of the “Parlamentarische Anfragen” website of the Austrian parliament (see here).
The reason behind it is that the website itself is relatively annoying to use, and provides very poor search functionality, i.e. no full-text search nor a direct search for inquierer and receiver.
Currently, this is merely a collection of very rudimentary functions.
Run the PoC
After installing the dependencies (BeautifulSoup4, requests, lxml), you can run the PoC with:
$ ./PoC.py
date: 25.10.2021
inquiry: {'desc': 'Schriftliche Anfrage der Abgeordneten Douglas   Hoyos-Trauttmansdorff, Kolleginnen und Kollegen an die   Bundesministerin für Landesverteidigung betreffend    Zukunft der Hackher-Kaserne', 'from': 'Eingebracht von:    Douglas Hoyos-Trauttmansdorff', 'to': 'Eingebracht an:    Mag. Klaudia Tanner Regierungsmitglied     Bundesministerium für Landesverteidigung', 'refs': [{'url': 'https://www.parlament.gv.at/PAKT/VHG/XXVII/J/J_08414/imfname_1007132.pdf', 'ref': 'Anfrage (gescanntes Original) / PDF, 648 KB'}, {'url': 'https://www.parlament.gv.at/PAKT/VHG/XXVII/J/J_08414/fname_1007151.pdf', 'ref': 'Anfrage (elektr. übermittelte Version) / PDF, 85 KB'}, {'url': 'https://www.parlament.gv.at/PAKT/VHG/XXVII/J/J_08414/fnameorig_1007151.html', 'ref': 'HTML, 85 KB'}]}
number: 8414/J
progress: has not been answered
relative url: /PAKT/VHG/XXVII/J/J_08414/index.shtml
title: Zukunft der Hackher-Kaserne (BMLV) - Frist für die Beantwortung 25.12.2021
url: https://www.parlament.gv.at/PAKT/VHG/XXVII/J/J_08414/index.shtml
Este é um sistema simples de bolão da Copa implementado em PHP. O sistema permite que os usuários se cadastrem, criem palpites para os jogos da Copa do Mundo e acompanhem a pontuação ao longo do torneio.
Requisitos
Certifique-se de que o seu ambiente de desenvolvimento atenda aos seguintes requisitos:
PHP 7.0 ou superior
MySQL ou outro sistema de gerenciamento de banco de dados compatível com PHP
Servidor web (por exemplo, Apache)
Configuração
Clone o repositório:
https://github.com/Igorpereirag/Bolao_copa.git
Configure o banco de dados:
Importe o arquivo database.sql no seu sistema de gerenciamento de banco de dados para criar a estrutura necessária.
Edite o arquivo config.php com as informações do seu banco de dados.

 Il primo stadio prende gli input del top-level produce i numeri X e Y normalizzati, DNORMX corrisponde sempre al numero più piccolo e DNORMY al numero più grande, nel caso il numero più piccolo sia negativo sarà prodotto il suo complemento a uno (a cui verrà sommato 1 nel prossimo stadio della pipeline per produrre il complemento a due), il numero più grande viene invece eventualmente inoltrato in complemento a due. Gli input del top-level sono inoltre analizzati dal modulo CLU per produrre i segnali PINF, NINF e NAN (tutti da un solo bit) che indicano se l’output dell’operazione è un numero speciale, è importante notare che questi segnali sono one-hot, non è infatti possibile che il risultato possa essere allo stesso tempo due numeri speciali diversi. Questi segnali possono valere 1 solo se almeno uno degli input del top-level è un numero speciale. Viene anche inoltrato allo stadio successivo l’esponente del numero più grande.
  https://github.com/SigCatta/Sommatore_IEEE754